Fish Farming – A Major Food Source

Global fishery statistics are not very reliable, but it can be asserted with reasonable confidence that aquaculture and the catching of wild fish are about equally important as human food sources.

In a previous post, I noted the FAO’s prediction that “by 2012 more than 50% of global fish consumption will originate from aquaculture” (1).  The FAO has now published its 2012 figures, so how did this prediction turn out?

Before trying to answer this question, let’s note some pitfalls in the interpretation of the FAO’s statistics.  Firstly, the FAO publishes figures both for fish only (sometimes termed finfish), and for a wider group of aquatic animals.  The latter includes not only fish but also crustaceans (shrimp, prawns, crabs, etc) and molluscs (oysters, clams, squid, etc.), but not aquatic mammals (whales, seals, etc.).  These other groups account for a higher proportion of production from aquaculture (34%) than of capture production (14%) (2), so the relative importance of aquaculture will tend to be under-stated if comparison is made in terms of fish only.

Secondly, the FAO’s figures are derived from those submitted to it by individual countries which may, for various reasons, be either over- or under-stated.  So far as capture production is concerned, much small-scale fishing in poor countries is probably omitted from the figures simply because for logistical reasons the data is never collected.  More significant, however, is deliberate under- or over-reporting which may occur at local, regional or national level.  Local under-reporting may occur where fishing is carried out in breach of national policies such as gear restrictions, closed seasons or catch quotas.  Higher-level under-reporting may have as its aim to disguise the extent of fishing (legal or otherwise) in foreign waters.  On the other hand, over-reporting can occur at regional level where politicians are judged on their success in promoting economic growth.  These factors probably apply to many countries, but China’s figures have attracted particular attention, partly because they are so large as to have a major impact on global totals.  Watson and Pauly (2001) (3) concluded that China was greatly over-reporting its capture production in its own waters, while a report for the European Parliament (2012) (4) estimated that China was under-reporting capture fishery production in distant waters.  Aquaculture production may be less likely to be under-reported, partly because aquaculture installations have a certain permanence that is hard to conceal. Politically-motivated over-reporting, however, could apply just as much to aquaculture as to capture production. The overall effect of misreporting is hard to assess.

Thirdly, the distinction between aquaculture and capture production gives rise to borderline cases.  The FAO Yearbook 2012 presents a three-way classification into aquaculture and two categories of capture production – traditional and enhanced -, with the enhanced category including production from lakes and rivers that have been stocked with fish or enhanced via predator control (5). However, this is offered as a proposal, to foster international harmonization of data, strongly suggesting that such borderline cases may not have been treated consistently in the 2012 figures.

Fourthly, only about 86% of overall production is for human consumption, the remainder being used mainly for the manufacture of fish meal and fish oil (6).  Nearly all of the fish not used for human consumption is from capture production (7).  Thus the proportion of aquaculture in production for human consumption is higher than that in total production.

Fifthly, consumption may be measured by weight or by value.   Value per unit weight may vary for several reasons: on the demand side, different proportions of inedible bones, shells, etc. and consumer preferences for particular species which may vary between countries; and on the supply side, the location of production and consequent differences in transport costs to consumers.  The average value per tonne of aquaculture production is 64% higher than that of capture production (8).  One reason is that aquaculture production includes a higher proportion of higher-value species such as salmon, trout, shrimp and prawns.  Another is that, even within species groups, the value per tonne of aquaculture production is in most cases higher (9).  This is not surprising since aquaculture facilitates improved production quality via species selection, control of feeding and timing of harvesting, and transport costs may be lower than for marine fishing.  However, the 64% difference relates to all production including that not for human consumption.  The average value of capture production is probably pulled down by its lower proportion of production for human consumption, but even if the value of production not for human consumption were valued at nil, the difference would still be 29% (10).  A reasonable assumption, given that production not for human consumption certainly has value, might be a difference of 40%, implying an average value per tonne of production for human consumption of $1,500 for capture production and $2,100 for aquaculture.

The following table summarises the conclusions supported by the above analysis:

Fish & Aquaculture 2012 Table

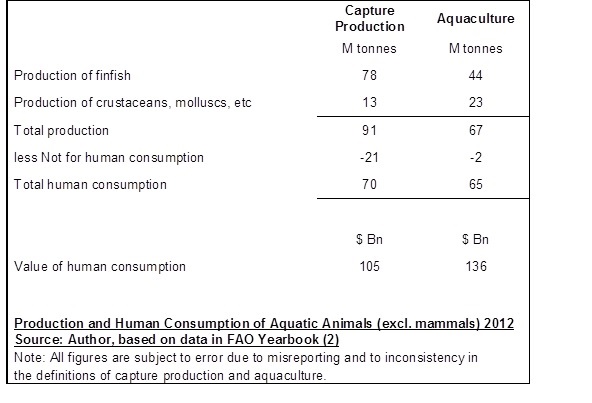
So the prediction that more than 50% of global fish consumption will originate from aquaculture has probably been fulfilled if fish is taken to include crustaceans and molluscs, and if consumption is measured in terms of value.  On any other basis it may not yet have been fulfilled, although with continuing growth in aquaculture it probably will be within a few years.

Notes and References

(1) FAO http://www.fao.org/fishery/regional-aquaculture-reviews/reviews-2010/en/

(2) FAO Yearbook 2012: Fishery and Aquaculture Statistics  http://www.fao.org/3/a-i3740t.pdf   These percentages may be derived from figures on p xvi (for aquaculture) and p 7 (for capture production)

(3) Watson, R & Pauly, D (2001) Systematic distortions in world fisheries catch trends  Nature 414: 534-536 http://www.nature.com/nature/journal/v414/n6863/abs/414534a.html

(4) Blomeyer R et al (2012) The Role of China in World Fisheries http://www.europarl.europa.eu/meetdocs/2009_2014/documents/pech/dv/chi/china.pdf

(5) FAO, as 2 above, pp 21-22.

(6) FAO, as 2 above, p xvii

(7) FAO, as 2 above, pp xvi & xxiv. This may be inferred by comparing Figure 1 on p xxiv, which shows food fish supply from capture fisheries and aquaculture respectively as about 70 Mt and 65 Mt, with the total supply figures on p xvi of respectively 91 Mt and 67 Mt.

(8) FAO, as 2 above, p 50.  The average value per tonne for capture production is $114.8 Bn divided by 91.3 Mt = $1,260, while that for aquaculture is $137.7 Bn divided by 66.7 Mt = $2,060.

(9) FAO, as 2 above, pp 48-50.

(10) Capture production $114.8 Bn divided by 70 Mt = $1,640; aquaculture $137.7 Bn divided by 65 Mt = $2,120.

Posted in Fisheries | Tagged , , , | Leave a comment

Progress with Carbon Capture and Storage

The recent launch of a large-scale power station retro-fitted with carbon capture and storage (CCS) is an important step forward in addressing climate change.  It is no criticism to add that many issues surrounding CCS remain to be resolved.

The world will be highly dependent on coal as an energy source for many years to come.  Coal-fired power stations are a major source of carbon dioxide (CO2) emissions which accumulate in the atmosphere, contributing to global climate change.  If CCS can be made to work at power stations in various circumstances around the world, then it will be less difficult than it would otherwise be to reduce CO2 emissions on a scale which will substantially mitigate climate change while ensuring that there is enough energy to support economic growth and development.  Note that I do not say it will be easier: the ideas of ‘ease’ and ‘addressing climate change’ simply do not go together.

It is therefore very good news that SaskPower has re-built and fitted with carbon capture technology an old coal-fired power station at Boundary Dam, Saskatchewan, Canada.  Its website gives an interesting overview of what the carbon capture facility looks like and how it works (1).  However, there is no need to rely on the company’s own evaluation of its achievement.  The International Energy Agency has hailed it as a “historic milestone” and stated that “the experience from this project will be critically important” (2).

Some 20% of the project cost was funded by the Canadian government (3).  No doubt there was an element here of supporting an infant industry, seeking to reinforce Canada’s position as a global leader in CCS technology.  Nevertheless, it is very much to the credit of Canada, a country less at risk from climate change than many others, and perhaps potentially a net gainer via improved agricultural yields and reduced heating costs, that it should have committed funds to a project designed to reduce CO2 emissions.  Moreover, this is exactly the sort of low-carbon investment that is appropriate for government support – an innovative facility which may demonstrate the feasibility of a technology and provide lessons which may enable others to apply the technology more effectively or at lower cost.  By contrast, the case for using public funds to support large-scale investment in a particular generation of low-carbon technologies that may soon be superseded – subsidies for homeowners to fit solar panels, for example – is much more dubious.

The implications of the storage aspect of CCS are easy to overlook.  While the success of the capture aspect can be ascertained quite rapidly, it would be premature to state that a CCS project works until the effectiveness of the storage has been demonstrated over a period of years.  There is little point in incurring large costs to capture and store carbon if a significant proportion will eventually find its way into the atmosphere via gradual leakage from store, or sudden release triggered by some unforeseen event.  There can also be local risks to humans and wildlife from releases of CO2 (4).  Reliable storage is partly a technical problem of identifying suitable chemical and physical forms and locations in which to store carbon, the range of options under consideration being quite wide (5).  But there is also an institutional problem of ensuring that, once carbon has been transported away from a power station, someone will be responsible for preventing leakage, for monitoring to detect any leakage, and for taking suitable action if leakage should occur.

In the case of Boundary Dam, there are two destinations for the captured carbon.  Some will be stored some 3 kilometres underground in Aquistore, a facility administered by the Petroleum Technology Research Centre, a not-for-profit body accountable to the Government of Saskatchewan and other Canadian public bodies (6).  However, the main destination appears to be nearby oil fields, where it will be sold and used for enhanced oil recovery, and this revenue stream is critical to the project’s financial viability (7).  This prompts several questions.  Once the carbon has passed to a company whose priority is oil production, will prevention of carbon leakage be given adequate attention?  Who will be responsible for the carbon once an oil well runs dry?  And can the costs of CCS be sufficiently reduced that it will be financially viable without the need to rely on public subsidy or local demand for the captured carbon?

Notes and references

  1. SaskPower CCS http://www.saskpowerccs.com/
  2. International Energy Agency, Press Release 1 October 2014 http://www.iea.org/newsroomandevents/pressreleases/2014/october/iea-hails-historic-launch-of-carbon-capture-and-storage-project.html
  3. MIT Carbon Capture & Sequestration Technologies Program: Boundary Dam Fact Sheet https://sequestration.mit.edu/tools/projects/boundary_dam.html
  4. Wikipedia: Carbon capture and storage – Leakage http://en.wikipedia.org/wiki/Carbon_capture_and_storage#Leakage
  5. Wikipedia: Carbon capture and storage – Sequestration http://en.wikipedia.org/wiki/Carbon_capture_and_storage#Sequestration
  6. Petroleum Technology Research Centre – About Us http://ptrc.ca/about-us
  7. Goldenberg S, The Guardian. 1 October 2014 Canada switches on the world’s first carbon capture plant http://www.theguardian.com/environment/2014/oct/01/canada-switches-on-worlds-first-carbon-capture-power-plant  See Yeates quote, 4th paragraph from end.
Posted in Climate change, Energy | Tagged , , , , | Leave a comment

Economics on the Beach

A busy beach offers an interesting economic case study.

I recently spent a few days on holiday with my family in Barcelona.  The weather was fine and each day we spent an hour or so on the beach.  I observed the scene: the crashing of waves; blue sky; white sails; larger ships in the distance; some people swimming; many more stretched out on the sand; occasional calls from itinerant drinks sellers; a life guard on a high chair.  I also began to ponder some economic questions …

What property rights apply to the beach?  This beach, like many beaches around the world, was clearly de facto open access.  No barrier restricted entry, and no payment was demanded for being on the beach.  Formally, I ascertained later, beaches and other coastal land in Spain belong to the state under laws intended to ensure public access and to limit coastal erosion or excessive urbanisation (1).

Beach at Barcelona Aug 2014

Looking at the matter from another perspective, what rights do people have in respect of the beach?  They have a right to enter and move about the beach, but this right is attenuated by the other people on the beach.  Once an individual or group has settled at a certain place, perhaps laying down a towel or a bag, others recognise that they have staked their (temporary) claim to that small area of beach, and generally will not dispute their claim.  This is unlikely to be a matter of formal law, but can be explained partly as a social norm, and partly in terms of the transaction costs (time and effort) that would probably be incurred by anyone disputing such a claim.

A beach could be so crowded that the attenuation of people’s rights would be severe, with groups uncomfortably close together and movement impeded (if so there might be a case for a congestion charge).  This was not the case in Barcelona, which has many fine beaches, so that if one becomes crowded people can simply go to another a little further from the city centre.

Given my interest in the travel cost method for valuing non-market goods, I wondered whether the evident demand for the services of drinks sellers offered a means of estimating the value of the beach to its users.  The argument would go as follows.  Barcelona has plenty of stationary drinks vendors (cafes, bars and shops) not far from the beach.  Anyone buying a drink from an itinerant seller on the beach is effectively paying a premium to avoid a few minutes’ walk to and from the nearest such vendor.  The premium provides a lower limit on that person’s value of time spent on the beach.  Averaging the values over people and grossing up by total annual hours on the beach should yield a minimum annual use value for the beach.

I doubt whether this could be developed into a practical valuation method, although it is an interesting thought experiment.  One limitation is that the base price against which premiums would be measured would be hard to specify since prices charged by cafes and bars will reflect the costs of their buildings, furnishing and décor.  Another is that time saved by not walking to buy a drink might be used to reduce total visit time, rather than increase time spent on the beach.  Furthermore, the value of time spent on the beach may be subject to diminishing returns, in which case the marginal value would be less than the average value.  Other limitations may occur to the reader.  More generally, the parallel with conventional travel cost method applications, which attempt to estimate a demand curve and consumer surplus, is far from perfect.

The question that occurred to me about the life-guard is whether the service that he provides (with any back-up support he may have) is a public good.  Considering first the condition of non-exclusivity, would it be possible to operate a service for rescuing people at risk of drowning and to limit it to paying customers?  One approach might be for customers to be issued with a coloured arm-band to be worn when in the water.  However, such an arm-band would be easy to imitate, and would not be visible at all times.  Moreover, any requirement for a life-guard to judge whether a person is entitled to service would conflict with the imperative of urgent action in a life-or-death situation.   On the other hand it seems conceivable that a solution could one day be found via tiny water-proof electronic devices a swimmer could wear that could sense if he or she was in difficulty, and alert a life-guard by wireless.

What about the other condition: non-rivalness?  If individuals rarely get into difficulty, and the timing of incidents is random, then it is indeed unlikely that assistance to one person would prevent assistance to another.  But there are other possible scenarios.  A group of people might venture together further into the water than is safe, given their competence as swimmers.  Sudden freak tidal conditions might jeopardise many swimmers at the same time.  In such circumstances, a life-guard might be unable to assist everyone at risk.

The conclusion to be drawn is that economic goods cannot always be neatly classified as private or public.  There are borderline cases, and the service provided by a life-guard is one.

Notes and references

1.  The relevant Spanish law is the Ley de Costas (Law 22 / 1988), as amended by Law 2 / 2013.  Useful sources are:
a) Spanish Property Insight  http://www.spanishpropertyinsight.com/legal/ley-de-costas-coastal-law/
b) Wikipedia – Coastal Act of Spain  http://es.wikipedia.org/wiki/Ley_de_Costas_de_Espa%C3%B1a

Posted in Recreation | Tagged , , , , , , | Leave a comment

Water: a Commodity AND a Human Right

The European Union has established a procedure for citizens’ initiatives.  The first such initiative to meet the threshold of 1 million signatures asks the EU to legislate to implement the human right to water, and to promote the public provision of water by dropping proposals to include water supply within the EU’s internal market (1). 

Under the procedure, the European Commission must carefully examine the initiative, meet with the organisers (in this case the European Federation of Public Service Unions), arrange for the organisers to present their initiative at a public hearing in the European Parliament, and adopt a formal response stating what action, if any, it proposes, and its reasons (2).

In total this initiative is supported by some 1.7 million valid signatures, of which more than 1.2 million are from Germany (3).  Only 7,104 are from the UK, where the water industry was privatised in the 1970’s.

Below is what I have written to Charles Tannock, one of the Members of the European Parliament for the London region.

Dear Mr Tannock

I am writing to comment on the European Citizens’ Initiative entitled ‘Water and sanitation are a human right! Water is a public good, not a commodity!’, which is the subject of a public hearing at the European Parliament on 17 February.  I write as an individual with an interest in natural resource economics, and am addressing this to you particularly in view of your membership of the European Parliament’s Human Rights Sub-committee.

The Initiative states three objectives, sandwiching a bad one – opposition to the inclusion of water supply within the EU’s internal market – between two broadly good ones about implementation of the human right to water both within the EU and globally.  It argues that the extension of the internal market to water supply would undermine fulfilment of the human right to water.  Against this view I would make the following points:

1. The human right to water is generally taken (eg by the United Nations Committee on Economic, Social and Cultural Rights) to refer to a minimum adequate quantity of water for drinking, cooking, personal hygiene and sanitation (4).  The amount of water needed for this purpose is only a small proportion of total water supply, perhaps 20 litres per person per day (5).  Much larger amounts of water are used by many households for less essential purposes, and by industry and agriculture, the total in the UK being of the order of 500 litres per person per day (6).  Any policies to ensure fulfilment of the right to water should target that specific objective, rather than driving arrangements for the whole of water supply.

2. Water is a scarce resource.  So far as England is concerned, this point was highlighted in the Walker Review 2009 (pp 39ff) (7).  Moreover human use of water can conflict with the maintenance of aquatic ecosystems which not only support wildlife but also provide a variety of environmental services important to humans.  The capital needed to provide water supply infrastructure is also a scarce resource.  For both water and capital, therefore, there is a need to manage demand and to allocate the resource between uses and users.  As with other goods, markets – including the EU’s internal market – have an important role to play because they can allocate resources to the uses in which they have the most value.

3. An important role for markets does not mean a completely free market.  In the UK, we have private, profit-seeking water companies which make charges to users.  We also have the Environment Agency to protect rivers and lakes from excessive abstraction of water for human use, the Drinking Water Inspectorate to set standards for the quality of drinking water, and OFWAT to limit the prices which the companies can charge to users.  The right to water is effectively protected by the last two regulators, by income support via the social security system for those who may have difficulty paying their water (and other) bills, and by requirements on water companies to use measures other than disconnection in the event of non-payment of bills.  None of this need change if the internal market is applied to water services.

4. Some other member states rely more than we do in the UK on public funding and control of the water industry.  Across the world there are a wide variety of forms of organisation of the water industry, and experience does not point strongly to any one as being best in all circumstances.  However, it is important to recognise that public funding and control can co-exist with private provision via various contractual arrangements.  This can in some cases improve services and reduce costs, just as contracting-out of other services has for many local authorities in the UK.  At the same time, public control can be used to ensure that contracted-out water services are delivered and charged for in a way that respects the right to water.  Any concerns that the internal market would in practice force full privatisation, meaning the complete removal of the water industry from public control, could be addressed by changes of detail, rather than by rejecting the internal market altogether in the case of water.

One of the most important pronouncements ever made about water was the Dublin Statement (so-named because it was made at an international conference held in Dublin as part of the preparations for the Rio de Janeiro Earth Summit in 1992).  Principle 4 of the Statement asserts (8):

“Water has an economic value in all its competing uses and should be recognised as an economic good.  Within this principle, it is vital to recognise first the basic right of all human beings to have access to clean water and sanitation at an affordable price.”

This gets the balance – between water as a commodity and water as a human right – exactly right.  It could well be a guiding principle for any action which the EU may take in response to the Initiative.

Yours sincerely

Adam Bailey

Notes and References

  1. The European Citizens’ Initiative, Official Register:  Water and sanitation are a human right! Water is a public good, not a commodityhttp://ec.europa.eu/citizens-initiative/public/initiatives/finalised/details/2012/000003
  2. The European Citizens’ Initiative, Official Register:   Basic facts http://ec.europa.eu/citizens-initiative/public/basic-facts
  3. As 1 above (near bottom of page)
  4. United Nations, Office of the High Commissioner for Human Rights,  Frequently asked questions on the rights to water and sanitation  See especially the question: Is there sufficient water to ensure enjoyment of the human right to water in all countries? http://www.ohchr.org/Documents/Issues/Water/FAQWater_en.pdf
  5. As 4 above.  See especially the question: Is 20 litres per capita per day sufficient for the full realisation of the right to water?  Note that even 50 to 100 litres per person per day would still be a small proportion of total water supply in the UK and most developed countries.
  6. DEFRA Estimated abstractions from all sources except tidal https://www.gov.uk/government/uploads/system/uploads/attachment_data/file/266837/v2iwtb23e-ab-allsource-201313_all.csv/preview   This shows annual abstraction in England and Wales for 2012 of 13,747 million cubic metres.  The population of England and Wales is c 55 million, implying abstraction per person per day of 13,747 / (55 x 365) = 0.685 cubic metres per person per day, equal to 0.685 x 1,000 = 685 litres per person per day.  I rounded this down to 500 litres per person per day as ‘use’ is a complex concept in relation to water, with some water used being recycled and available for re-use.
  7. DEFRA  The Independent Review of Charging for Household Water and Sewerage Services (the Walker Review), Final Report 2009  http://archive.defra.gov.uk/environment/quality/water/industry/walkerreview/final-report.htm
  8. World Meteorological Organisation The Dublin Statement, Principle No. 4  https://www.wmo.int/pages/prog/hwrp/documents/english/icwedece.html#p4
Posted in Water | Tagged , , , | Leave a comment