
The reform of the EU Common Fisheries Policy announced on 30 May is an important step towards sustainable and more profitable fishing. But the interests of the consumer merit more explicit recognition.
A stated aim of the reform is “to restore and maintain fish stocks above levels that can produce the MSY (maximum sustainable yield)” (1). The choice of “above” rather than “at” is intriguing. Bioeconomic models of the relationships between fish stocks, fishing effort and the value of fish caught do indeed suggest a sustainable optimum in which fish stocks are above the levels associated with MSY.
The simplest model (sometimes called the Gordon-Schaefer model) leads to the following well-known diagram (2) in which the curve shows the relation between revenue and effort in steady state (RE), that is, with catch equalling natural growth of the fish stock. In steady state, fish stocks are higher when effort is less, since higher stocks imply greater catch and revenue per unit of effort.

E(MSY) is the level of effort that maximizes catch and revenue. The cost of effort line is drawn with cost below revenue at E(MSY), reflecting the fact that fishing in EU waters is profitable in aggregate despite overfishing (excessive effort) in some regions (3). E(OA) is the open access equilibrium, a situation in which unregulated fishers pursue their individual interests, raising effort so high that reduced fish stocks and higher costs reduce profits to zero. E(MP) is the level of effort that maximizes profit, where marginal revenue – the slope of the revenue-effort curve – equals marginal cost. Current fishing effort in EU waters appears to be between E(MSY) and E(OA), and the reform rightly seeks to rebuild fish stocks by reducing effort.
Like all simple models, this simplifies reality in many ways. Fish come in many species, with different rates of growth and migratory characteristics, and different market prices. Fishing involves varied techniques of differing capital intensity, and fishing effort is not randomly applied. Fishing costs may fluctuate with changes in costs of inputs such as fuel. Intuitively, it seems reasonable to suppose that a model which averages such differences within a few simple measures can still tell us something useful. However, one limitation which is unhelpful in considering EU policy is that the model treats the price of fish as given.
Total demand for fish caught in EU waters can be expected to be downward-sloping since such fish represents about 40% of all fish consumed in the EU, the remainder comprising imports (50%) and aquaculture within the EU (10%) (4). Competition from imports, though important, is limited by consumer preferences for particular species and by tariff and non-tariff barriers. At the same time demand can be expected to be fairly price-elastic because of this competition, and because meat and other protein sources are to some extent substitutes for fish. It follows that changes in effort at steady state will be associated not only with changes in catch but also with changes in the price at which the catch can be sold.
Given price flexibility, there is a different steady-state revenue effort curve corresponding to each possible unit price. The diagram below shows such curves for prices P1, P2 and P3, where P1 is the price at which quantity demanded equals MSY. Since these curves never cross, each revenue-effort combination is on only one such curve and so associated with a unique price.
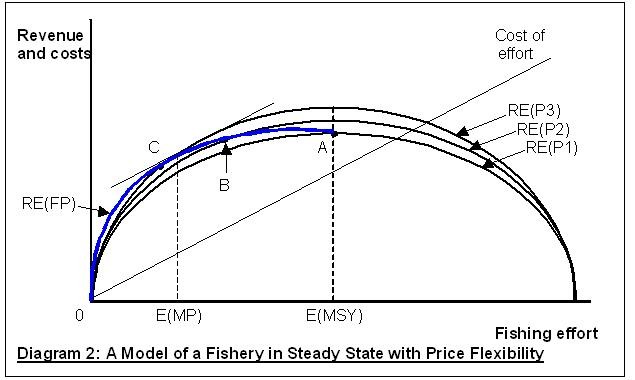
With effort at E(MSY), the steady state is at point A on RE(P1). Now consider the effect of progressively lower levels of effort. With less effort, catch is lower, so prices are higher and fish stocks are larger. At a certain level of effort, well below E(MSY) if demand is fairly elastic, price is P2, with steady state at B. At an even lower level of effort, price is P3 with steady state at C. The blue curve joins revenue-effort combinations at which demand at the associated price equals the steady state catch for the effort (the portion of the curve to the right of A is not shown). It could perhaps be called the flexible-price steady state revenue-effort curve (RE(FP)).
E(MP), effort to maximize profit, is where the slope of the blue curve equals marginal cost. But overall social welfare also depends on how different levels of effort and therefore catch and price impact on consumers. Consumer surplus is maximized at E(MSY), since price in steady state cannot be less than that at MSY. A measure of overall social welfare is the sum of profit and consumer surplus. Socially optimal fishing effort can be shown to be between E(MP) and E(MSY). One way to see this (5) is to note that, as effort is increased from E(MP) to E(MSY), the fall in profit is initially slow, because marginal revenue is close to marginal cost in the vicinity of E(MP), but becomes much faster towards E(MSY) as marginal revenue falls. The increase in consumer surplus, however, shows the opposite pattern, increasing more rapidly initially where the increase in catch and therefore the fall in price is faster.
The economic case for restricting fishing effort below the level that maximizes sustainable yield, therefore, is not that this is what is necessary to maximize fishing profits. Restricting effort permits larger fish stocks, increases catch per unit of effort, lowers costs, and raises fishing profits. However, it also changes the balance of economic benefit between fishers and consumers. Fishing in the EU is currently far from the profit-maximizing position. But as in other industries, measures to restrict output could be used to exploit consumers. It could help to build support for its reform if the EU were to state that the objective of restricting effort is to increase fish stocks and maximize social welfare, not to maximize the profits of the fishing industry.
Addendum (14/6/2014)
The mathematics of the above flexible price model is set out in this post.
Notes and References
1. EU Committee on Fisheries (Press Release 30/5/2103) European Parliament secures sustainable fisheries policy p 1 http://www.europarl.europa.eu/committees/en/pech/press-releases.html#menuzone
2. See for example Hartwick J M & Olewiler N D (2nd edn 1998) The Economics of Natural Resource Use p 114
3. European Commission (30/5/2013) Consultation on Fishing Opportunities for 2014: see p 2 re overfishing and p 6 re profitability http://europa.eu/rapid/press-release_IP-13-487_en.htm?lang=en
4. FAO Fishery and Aquacultute Statistics 2010: these approximate percentages may be inferred from information on pp xvii, 8, 27 & 52 http://www.fao.org/docrep/015/ba0058t/ba0058t.pdf
5. The proposition that social welfare is maximized at a level of effort between E(MP) and E(MSY) can also be derived algebraically if, in addition to other standard assumptions, it is assumed that that the demand curve is downward-sloping and linear.

