What determines the production quantities and relative prices of internationally-traded goods? Some textbooks suggest a misleading answer.
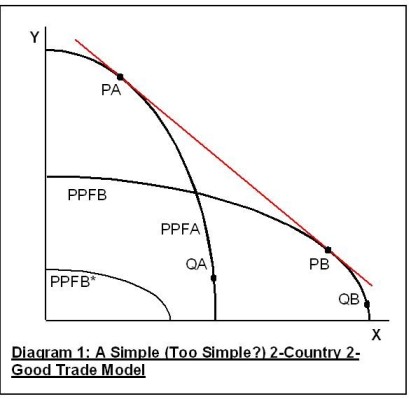
An old textbook I have on my shelves (Wells 1969 (1)) has a diagram similar to Diagram 1 below, showing the production possibility frontiers of two countries A and B producing two goods X and Y. The book suggests by the way the diagram is drawn that under free trade the ratio of the price of X to the price of Y is represented by the common tangent (shown in red). Consequently the points of tangency, PA and PB, represent the combinations of goods produced by each country.
This method of finding the free trade price ratio cannot be generally correct. Here are two reasons:
- Suppose country B is small, so that its production frontier is PPFB*, lying entirely within PPFA. Then the method cannot be applied since it is impossible to draw a straight line tangential to both PPFA and PPFB*. Given free trade, however, A and B will still engage in trade, provided only that their respective price ratios in the absence of trade are different, creating scope for gains from trade.
- Suppose consumers in both countries have a strong preference for X over Y, implying near-vertical social indifference curves. Then the method leads to wrong conclusions since production in that case will not be at PA and PB. It will be approximately at QA and QB, with both countries producing close to their maximum possible quantity of X.
This may seem to be labouring an obvious point. But perhaps it isn’t so obvious, since a modern textbook (Koo & Kennedy 2005 (2)) uses a similar diagram (with some additions), identifying the production quantities under trade equilibrium as the equivalent of PA and PB in Diagram 1. This is surprising since, only a few pages before, Koo & Kennedy give a correct explanation of the determination of the free trade price ratio in the 2-country 2-good case (3). Given each country’s production frontier and social indifference curves, this involves constructing a diagram showing their respective offer curves. The point of intersection of the offer curves then indicates the equilibrium import / export quantities and the price ratio.
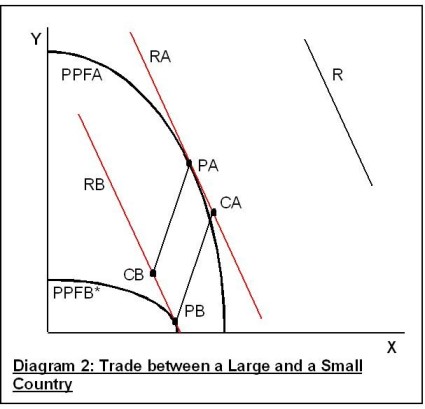
It then remains to find the associated production quantities. One way is to apply the free trade price ratio to a diagram showing the production frontiers. The point that is perhaps easy to miss is that one cannot in general draw a line of given slope that is tangent to both the production frontiers. In general two parallel lines must be shown, one for each country. It is the slope of a line, not its position, that represents a price ratio, so parallel lines represent the same price ratio. Diagram 2 shows how this works for the case of the large and small country.
R shows the slope of the price ratio, assumed to be inferred from an offer curve diagram. To find A’s production quantities, we find the point PA on its production frontier at which the tangent, RA, is parallel to R. Similarly B will produce at point PB on its production frontier, at which the tangent RB is parallel to R. Given A’s import and export quantities from the offer curve diagram, we can also find the point CA on RA representing A’s consumption quantities. Similarly we can find point CB on PB representing B’s consumption quantities.
A geometric proposition that is generally valid, whether or not the production frontiers overlap, is that the four production and consumption points (PA, PB, CA, CB) form the corners of a parallelogram. But for the two tangents to coincide, as in Diagram 1, so that all four points lie in a straight line, would just be a coincidence. It looks neat but has no economic significance.
Notes and References
1. Wells S J (1969) International Economics George Allen & Unwin, London p 42
2. Koo W W & Kennedy P L (2005) International Trade and Agriculture Blackwell Publishing pp 50-51
3. Koo & Kennedy, as above pp 41-43


Right on-this helped me sort things right out.