
Methane emissions per unit from lamb production are comparable with those from beef production.
In the second of my series of posts analysing UK climate change policy, I presented calculations of the methane emitted per kilogram carcass weight in the UK by beef cattle, sheep and pigs. The figures obtained (in tCO2e) were: beef cattle 0.0117; sheep 0.0039; pigs 0.0006. I drew the conclusion that beef cattle make by far the largest contribution of any livestock to climate change per kilogram of food produced. This in turn led to a proposal that the sale of beef should be taxed with the aim of reducing beef consumption and production and so reducing methane emissions. In support of that proposal I argued that many consumers regard beef and other kinds of meat as near substitutes, with the implicit suggestion that for consumers to switch from beef to lamb or pork would help reduce methane emissions.
The formula implicit in my calculations was:
Emissions per Kg carcass weight = (Annual emissions from relevant livestock x Typical age at slaughter) / (Population of relevant livestock x Typical carcass weight)
On reviewing my data sources, method of calculation and presentation of results I find four significant errors. Firstly, I used December population figures. This is appropriate for cattle and pigs, whose populations do not vary greatly over a year, but not for sheep. Typically, large numbers of lambs are borne in the early months of the year and slaughtered at around 6 months, so few are still living in December. In 2020, the sheep population at 1 June was 33.3M (1) but that at 1 December was only 21.8M (2). Thus the December sheep population considerably understates the average population over the whole year.
Secondly, my sources for carcass weight distinguished between, for sheep, ‘clean sheep’ and ‘ewes and rams’ and, for pigs, ‘clean pigs’ and ‘sows and boars’. I took simple averages of the weights for the two groups, obtaining weights of 25Kg for sheep and 120Kg for pigs. In fact, the vast majority of sheep and pigs slaughtered are clean sheep and clean pigs, and their average weights are 20Kg and 87Kg respectively (3). For sheep and pigs, therefore, my carcass weights were considerably overstated.
Thirdly, my method of calculation assumed that the only emissions due to production of a kilogram of meat are those from the individual animal from whose carcass that meat is cut. However, animals may play a variety of roles within the farming industry. In the case of sheep, of the 21.8M population at 1 December 2020, 13.9M (64%) were ‘female breeding sheep’ (4), that is, sheep who normally live for 5 to 6 years whose main role is to give birth to one or more lambs each year. These sheep account for a high proportion of the total emissions from sheep, and a share of their emissions should be included in calculating the emissions attributable to the production of lamb meat.
The implication of the second and third errors taken together, even if somewhat offset by the first error, is that my figure for sheep was considerably understated, and the suggestion that for consumers to switch from beef to lamb would reduce methane emissions is not justified. From the third error, I also draw the conclusion that the whole method, unless greatly refined, is flawed.
Fourthly, the title of the table in which my calculation was presented referred to ‘meat produced’, the suggestion being that livestock carcasses consist entirely of meat. The term ‘carcass weight’, as used in the meat industry, refers to the weight of a slaughtered animal after removal of the internal organs, parts of the legs and tail, the skin (except for pigs, whose skin is often cooked and eaten as crackling) and often the head (5). However, a carcass still contains much unsaleable bone and fat, and therefore does not consist entirely of meat as typically sold by a butcher or supermarket. Saleability of meat is not very well defined as consumers differ in their preferences for different cuts, for meat with or without bone, and for fat and lean. There are also differences between types and breeds of animals, and between individual animals, in their proportions of bone and fat. As a very rough approximation drawn from a range of figures in numerous sources, however, the ratio of saleable meat to carcass weight is about 70%. This means that, even if the above three errors were to be corrected, my figures would still significantly understate methane emissions per kilogram of saleable meat.
I now think that a more reliable and meaningful calculation is via the following formula:
Emissions per Kg saleable meat = (Annual emissions from relevant livestock x 100) / (Annual production (carcass weight) from relevant livestock x 70)
This formula avoids the need to consider livestock populations and roles, and annual production figures in terms of carcass weights are available from DEFRA. It may be asked whether some emissions should be attributed to milk and other dairy production from cows and to wool production from sheep. However, the UK national statistics for greenhouse gas emissions already distinguish methane emissions from beef cattle from those for dairy cattle, so it seems reasonable to include just the former. UK wool production is low in weight terms compared to that of sheep meat (6), and its market value per kilogram in recent years is extremely low (7).
Applying this formula to 2022 data I obtained Table 1 below:
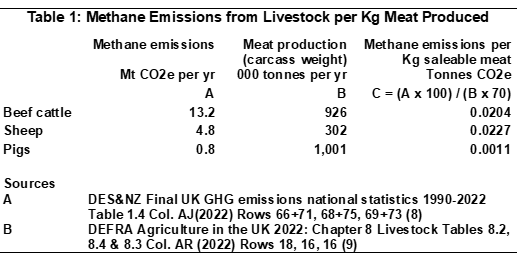
These figures should not be taken as highly accurate. Much supporting detail can be found in the UK’s submission to the UNFCCC which, in particular, quotes estimates of uncertainty for methane emissions due to enteric fermentation showing a width of about 10% for the 95% confidence interval (10). There is also a degree of approximation implicit in the categorisation of cattle between dairy and beef (11). Nevertheless, the results clearly show that methane emissions from producing 1 kilogram of beef or lamb are very much higher than those from producing 1 kilogram of pork, as might be expected given that cattle and sheep are ruminants while pigs are not. The fact that the figure for lamb is somewhat larger than that for beef is probably within the margin of error of the method. However, the similarity of these figures indicates that my proposal that the sale of beef (but not lamb) should be taxed is in need of review, and I hope to address this in a future post.
In conclusion, let me address the possible question: why does this matter? Briefly, methane is a powerful greenhouse gas, about 28 times more powerful than carbon dioxide over a 100 year period, and within total UK methane emissions, those from beef cattle and sheep amount to about 32% of the total (12).
Notes and references
- DEFRA Farming Statistics – Livestock Populations at 1 December 2020, UK Table 3 p 9 https://www.gov.uk/government/statistics/farming-statistics-livestock-populations-at-1-december-2020-uk
- DEFRA Farming Statistics – Provisional Arable Crop Areas, Yields and Livestock Populations at 1 June 2020, United Kingdom para 1.12 p 11 https://www.gov.uk/government/statistics/farming-statistics-provisional-crop-areas-yields-and-livestock-populations-at-1-june-2020-united-kingdom
- DEFRA Agriculture in the United Kingdom 2020 Chapter 8 Livestock, Tables 8.3 & 8.4 pp 85-6 https://www.gov.uk/government/statistics/agriculture-in-the-united-kingdom-2020
- DEFRA, as (1) above, Table 3 p 9
- Wikipedia Dressed Weight https://en.wikipedia.org/wiki/Dressed_weight
- Statista Annual production of greasy wool in the United Kingdom from 2010 to 2022 https://www.statista.com/statistics/1220249/united-kingdom-uk-greasy-wool-production/
- DEFRA British Wool Review 2022, Market Analysis, Figure 1 https://www.gov.uk/government/publications/british-wool-review-2022/british-wool-review-2022
- DES&NZ Final UK Greenhouse Gas Emissions National Statistics 1990-2022 (data tables, Excel) https://www.gov.uk/government/statistics/final-uk-greenhouse-gas-emissions-national-statistics-1990-to-2022
- DEFRA Agriculture in the United Kingdom 2022 Chapter 8 Livestock (scroll to Table 1b and download the full livestock dataset) https://www.gov.uk/government/statistics/agriculture-in-the-united-kingdom-2022/chapter-8-livestock
- UNFCCC: UK National Inventory Report 2023 https://unfccc.int/documents/627789 Click on Download, then English ZIP to obtain a list of files. From the list, open Annex and go to p 745. Enteric fermentation is source category 3A.
- UNFCCC, as (10) above. From the list of files, open Main and go to p 336, which states that four subcategories (dairy calf < 1 year, dairy replacement > 1 year not in calf, dairy replacement in calf, dairy cow) are included under dairy cattle. However, use of the NAEI data selector at https://naei.energysecurity.gov.uk/data/data-selector with selection on Greenhouse Gases, 2021, 2021, Methane, Agriculture, 3A1a Enteric Fermentation Dairy Cattle and 3A1b Enteric Fermentation Non-dairy Cattle, Enteric yields selected data with only dairy cows classified as 3A1a and all other sub-categories classified as 3A1b. The 2021 figure for dairy cows (230.0802 000t methane) corresponds (x 28) to 6.4 Mt CO2e which is the figure for dairy cattle 2021 in (8) above table 1.4. Similarly, the total of the 2021 figures for all the other subcategories, ie those classified 3A1b, (416.4370 000t) corresponds (x 28) to 11.7 Mt CO2e which is the figure for beef cattle 2021 in (8) above table 1.4 and is part of the 13.2 shown in Table 1 above (the other 1.5 being due to manure management). Prima facie, this appears to be an error and, if so, the implication is that my figure in Table 1 of 0.0204 t CO2e per Kg saleable beef is a little on the high side, although any degree of error is not so large as to undermine the conclusion that methane emissions per Kg are very much higher for beef than for pork.
- DES&NZ, as (1) above, from Table 1.4 row 107, total methane emissions in 2022 were 56.4 MtCO2e, of which (see my Table 1) 18.0 MtCO2e were attributable to beef cattle and sheep.

