
Long-term forecasting of the aggregate production function is essential for assessing sustainability, but very difficult.
Is our current living standard sustainable? Or does depletion of non-renewable natural resources such as fossil fuels and metal ores mean that it must eventually decline? And if the latter, what lower standard of living, if any, would be sustainable? A well-founded sustainability criterion, enabling us to give clear and convincing answers to those questions, could make an important contribution to public debate on economic policy. In particular, it could help counter the view that growth in GDP is the key indicator of economic performance.
Qualitatively, it is fairly clear how it might be possible to sustain consumption while non-renewable resources are progressively depleted. We start from two reasonable assumptions: that production technology will permit a considerable degree of substitution between inputs, and that there must always be at least some input of non-renewable resources. Inputs of non-renewable resources must therefore be ever-decreasing so that reserves are never totally exhausted (in mathematical terms, the stock of non-renewable resources must be asymptotic to zero).
To maintain output and consumption in those circumstances, there must be increasing inputs of reproducible capital (which includes both capital equipment and infrastructure and renewable natural resources). Furthermore, it will not be sufficient simply to maintain output: output must grow to provide not only for consumption but also for the necessary investment in reproducible capital and for offsetting depreciation of the increasing stock of that capital.
Whether this scenario is feasible will depend on a number of variables: the initial stocks of capital and resources, resource extraction costs, production technology, population and labour inputs, current consumption and (if we are considering the economy of one country rather than of the whole world) opportunities for trade. There are difficulties of measurement and/or forecasting associated with several of these variables. This post will argue that, in particular, the forecasting of production technology presents a major challenge in assessing sustainability.
That might seem a surprising claim. After all, economists have put much effort into the estimation of aggregate production functions and into economic forecasting using models in which a production function is one component (1). The problem is that, to assess long-term sustainability, we need to estimate the relation of output to inputs for future periods in which the ratio of reproducible capital to input of non-renewable resources will be vastly greater than at present. And that is very difficult.
To illustrate the point, I shall consider the assessment of sustainability within a model having the following simplifying assumptions:
- Output of a single good which can be either consumed or invested as reproducible capital.
- A Cobb-Douglas production function with technical progress Y = AKαRβ(1.01t) , where K is man-made capital, R is use of a non-renewable resource S, extracted at nil cost, t is time in years from the present, and A, α and β are parameters.
- Constant population and labour (this is why, although production requires labour, labour does not appear as a variable in the production function).
- Depreciation of reproducible capital at 5% per annum.
- Initial stocks: 100 units of K and 100 units of S (the respective units need not be the same).
The assumption of technical progress at a constant 1% per annum, implicit in 2 above, is made to facilitate a focus on the rest of the production function and keep the mathematics of the model reasonably simple. The actual rate of future technical progress is difficult to forecast, but that is a reinforcement, not a criticism, of the argument presented here.
The question I shall explore is whether, within this model, annual consumption of 100 units (the same units as those of K) is sustainable. This will depend on the parameters of the production function. Consider the following functions:
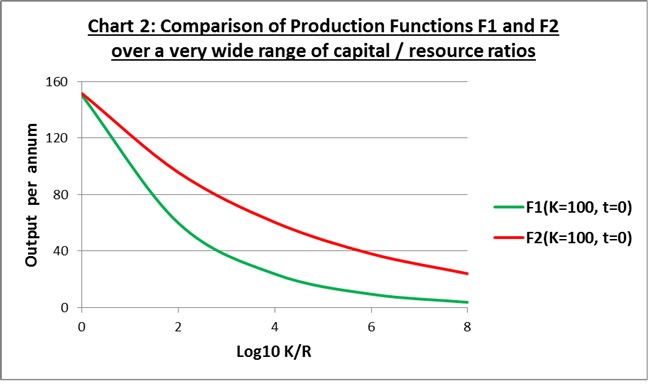
F1: Y = 15K0.3R0.2(1.01t)
F2: Y = 24K0.3R0.1(1.01t)
This pair of functions has the following property: if K approximates to 100 and K/R to one, then they yield very similar values of Y (because 15 x (1000.1) ≈ 24). This is illustrated, for the case t = 0, by Chart 1 below.

Suppose we had to decide whether the production function is F1 or F2 on the basis of input and output data for recent periods in which K/R is in the vicinity of one. Given the inevitable random variation in output due to other variables, this would be extremely challenging. Statistical tests would at best point to one function as slightly more likely than the other.
At the very much higher K/R ratios that sustainability requires, however, the difference between these functions becomes very significant, as shown in Chart 2 below (note the log scale on the horizontal axis).
Because the same inputs yield more output with F2 than with F1 whenever K/R exceeds one, we expect that sustainable consumption will be greater given F2. To find out how much difference this makes I set up the model in discrete form as a spreadsheet with one row per year for 5,000 years. Key features of the spreadsheet are as below:
- Consumption in each year equals that for year 0.
- Growth of capital equals output less consumption less depreciation.
- Marginal product of capital is calculated directly using the standard formula (for a Cobb-Douglas production function) MPK = αY/K.
- Marginal product of the resource is calculated directly (MPR = βY/R) for year 0, but subsequently using the Hotelling rule according to which the rate of growth of the marginal product of the resource equals the marginal product of capital (2).
- Extraction and use of the resource after year 0 is calculated backwards from its marginal product and output (to avoid circularity, the output figure used is that for the previous year).
- Resource stock after year 0 is that for the previous year less extraction and use for the previous year.
- Consumption and extraction / use of the resource for year 0 are trial values. A pair of trial values is considered feasible if it generates time paths for the variables in which, during years 0 to 5,000, the resource is not exhausted and output is never less than consumption.
The maximum trial value of consumption consistent with feasibility as defined above is an approximation to maximum sustainable consumption (it’s only an approximation because of the discrete spreadsheet approach and because of the 5,000 year time horizon). It was found that:
- With production function F1, constant consumption of 100 units is unsustainable as maximum sustainable consumption is approximately 79.7 units.
- With production function F2, constant consumption of 100 units is sustainable as maximum sustainable consumption is approximately 117.6 units.
So the assessment of whether consumption of 100 units is sustainable rests on the weak foundation of whether F1 or F2 in Chart 1 above provide a better statistical fit to current and recent data.
A possible objection is that the implicit sustainability criterion, that is, the feasibility of consumption at 100 units per annum forever, or for 5,000 years, is too demanding. Suppose instead, therefore, that we set the time horizon at just 100 years. Surprisingly, perhaps, this makes very little difference to the conclusion. For F1, maximum sustainable consumption increases from 79.7 to 80.0 units. For F2, it increases by such a tiny amount that on rounding to one decimal place, maximum sustainable consumption is still 117.6 units.
Addendum 1 November 2017
A further possible objection is that if the initial stock of the resource is 100 units, then it is not very plausible to assume that resource use in the preceding years used to estimate the production function was in the region of 100 units per annum. To address this, I considered the effects of assuming initial stocks of the resource of 1,000 units and 10,000 units (in each case with initial capital of 100 units and over 5,000 years). With 1,000 units, maximum sustainable consumption was 138 units with F1 and 151 units with F2. With 10,000 units, maximum sustainable consumption was found to be higher with F1, 239 units, against 194 units with F2. The important point, however, is that for each of these variations, maximum sustainable consumption depends significantly upon the production function.
The spreadsheet used to derive the above charts and results may be downloaded here:
Constant Consumption with Different Production Functions Adam Bailey
Notes and References
- One example is the NIESR’s NiGEM model: see https://nimodel.niesr.ac.uk/nigem-intro/nigemintro.php?t=1&b=1&w=1
- A derivation of this form of the Hotelling rule may be found in Perman R, Ma Y, McGilvray J & Common M (3rd edn 2003) Natural Resource and Environmental Economics Pearson Addison Wesley pp 660-1, the rule being equation 19.42j.

