
At what rate should an essential non-renewable resource be depleted to sustain an economy for as long as possible?
Suppose the inputs of a closed economy consist of produced capital, a non-renewable resource and labour . Output is of a single good which can be either consumed or added to the stock of produced capital. The quantity of output is determined by a constant-returns Cobb-Douglas function, implying in particular that if any of the inputs is nil then output is nil. Technology is constant, as is labour input. Produced capital depreciates at a constant positive rate .
Question: Given that (as explained in my previous post) constant consumption cannot be sustained forever, for what length of time can it be sustained at a given rate, and at what rate should the resource be depleted to achieve that maximum time?
Suppose the production function is:
Y(t) = A(K(t))α(R(t))β (A,α,β > 0; α + β < 1)
where:
Y(t) = output at time t;
K(t) = stock of produced capital at time t;
R(t) = rate of use of a non-renewable resource at time t;
A, α, β are fixed parameters, the value of A reflecting the technology and the labour input, both of which are assumed constant.
The initial stocks of produced capital and the resource are K0 and S0, and depreciation of produced capital is at a rate δK(t) (0 < δ < 1). We wish to find the maximum duration T for which consumption can be sustained at a given rate C, and what the associated time path of use of the resource.
The charts below show the optimal time paths when A=1, α = 0.3, β = 0.2, δ = 0.1, C = 2 and K0 = 100, with several values of S0. I start with S0 = 5, for which the maximum duration of consumption at the given rate is 22, the optimal time path of use of the resource being as shown in Chart 1 below.
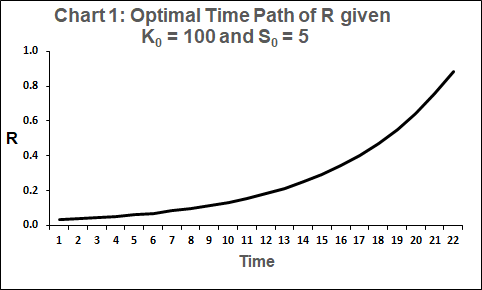
Even in this simplest case, the optimal rate of use of the resource is not constant. Use of the resource increases over time, being always just sufficient for output to equal the required rate of consumption. There is no additional output to offset depreciation, so capital decreases, which is why use of the resource must increase to sustain output and consumption.
When the initial stock of the resource is larger, the possibility of setting use of the resource as always just sufficient for output to equal the required rate of consumption may not be optimal, but remains available. Thus the time until the resource is exhausted when its use follows that path provides a lower bound on the maximum duration. We can state:
Proposition 1: A lower bound on the maximum duration T is given by:
with strict equality if:
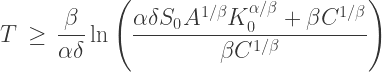
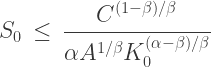
In the case shown in Chart 1 the strict equality condition is satisfied. We now consider the case S0 = 30, for which the condition is not satisfied. In this case Proposition 1 implies that T is at least 33, but it is in fact 34, this slightly longer duration being obtained when the time path of R is as shown in Chart 2.
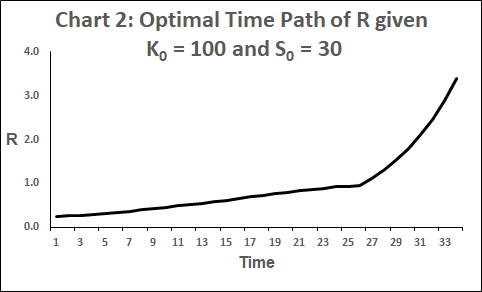
It can be seen that the time path of use of the resource is slightly kinked at around time t = 26. After the kink, it follows the simple path described above. Before the kink, use of the resource is somewhat more than sufficient for output to equal the required rate of consumption, so that there is a little extra output offsetting part of the depreciation.
The timing of the kink depends on the depletion of the resource. When the initial stock of the resource is sufficiently large, it is worthwhile to use some of it to invest in produced capital, because a larger stock of produced capital enables output and consumption to be sustained with less use of the resource. When the remaining stock of resource becomes sufficiently small, the maximum time over which the required rate of consumption can be sustained becomes so small that it is not worthwhile to use any of the resource to invest in produced capital. How small is sufficient in any particular case depends on the values of the various parameters.
Chart 3 shows the optimal time path when S0 = 500. The maximum duration is 104, much more than the lower bound implied by Proposition 1, which is 52. Here the kink, at t = 101, is much sharper and proportionately much closer to the maximum duration.
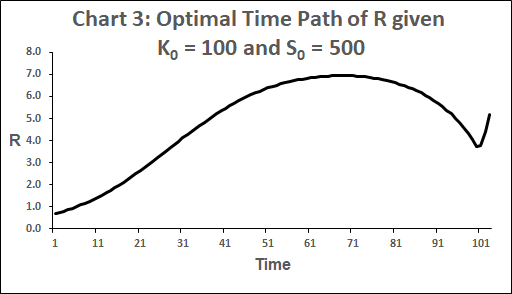
What is especially striking in Chart 3, as compared with Charts 1 and 2, is the concave shape of most of the optimal path. It is also notable that use of the resource increases over the range 1-70, then decreases, then increases again after the kink. To understand this apparently bizarre behaviour we will proceed directly to Chart 4, which shows the optimal path when S0 = 2000.
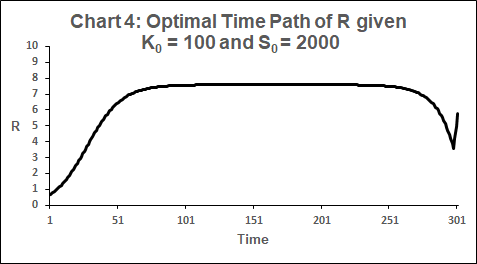
Here the optimal path is still concave over most of the time period, but almost constant over the range 80-240. Capital is almost constant over the same period, during which output exceeds the required rate of consumption by almost exactly enough to offset depreciation.
There are many possible combinations of capital and use of the resource having the property of keeping capital constant. Among these is one which minimizes the rate of use of the resource, and that minimum rate is approximately 7.59, which is the value to which in Chart 4 it approximates over the range 80-240. Being the smallest such value it enables the required rate of consumption to be sustained for the longest time from a given quantity of resource. Using a term common in the study of optimisation problems, we may describe the almost constant section of the time path as a turnpike.
We can now see why the path in Chart 3 takes the shape it does. It is trying, as it were, to reach the turnpike, but the stock of resource is not quite sufficient. Nevertheless, getting close to the turnpike for at least a small part of the time path contributes to maximising the duration.
Returning to the case S0 = 2000 (Chart 4), the lower bound on the maximum duration implied by Proposition 1 is 61, a very poor approximation to its actual value, 302. However, when the initial stock is sufficiently large that the turnpike occupies a high proportion of the optimal time path, we can obtain a much better approximation by dividing S0 by the value of R during the turnpike. Hence we arrive at:
Proposition 2: If S0 is large then a reasonable approximation to the maximum duration T is given by:
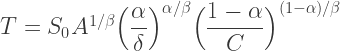
For S0 = 2000 this yields a value of 264, reasonably close to 302.
The mathematics underlying the above may be found in the following two downloads. (pdf and Excel 2019 format respectively)

